

Most traders know the feeling – looking at your trading platforms, adding a few trading indicators into the mix and trying to anticipate what comes next in the markets. However, far too often, you find yourself caught in a loop of lagged signals and market noise due to old-school approaches like traditional RSI and moving averages. Using old methods today will quickly drain your cash.
That’s precisely why top-notch traders need sophisticated tools such as custom, proprietary software that enables them to have a clear vision of future market moves. One of the smartest new solution in this field is Tradepedia Indicators, a set of algorithms created for objective analysis and filtering of market data and trends.
These indicators were invented by trading market veteran Avramis Despotis and are designed to allow both individual and institutional traders to interpret price movement objectively. Below we will examine how Avramis’ indicators work and how they differ from regular trading tools.
The Core Problem with Traditional Trading Indicators
In order to comprehend the importance of our advanced system, we need to address some shortcomings of conventional indicators. Most retail charting applications use calculations based on time. They take an average of past closing prices for a certain period of time expressed in candles.
Whereas this system works efficiently in a steady trend situation, it becomes totally ineffective during two very crucial stages:
1. Violent Choppy Markets: When conventional indicators give out hundreds of contradicting buy/sell whip-saw signals.
2. Market Volatility Surges: When the delayed signal makes you join the trend right after the huge price move.
With a lagging technical analysis, your risk management strategy becomes vulnerable. The innovation of the Tradepedia ecosystem changes everything.
Unlocking the Secret to Avramis Indicators
Rather than merely smoothing historical data, Tradepedia Indicators operate based on particular pillars of market mechanics, including the measurement of volatility, multiple-timeframe correlation, and time-independent price action. This is how the primary set of algorithms works in order to provide a significant trading edge.
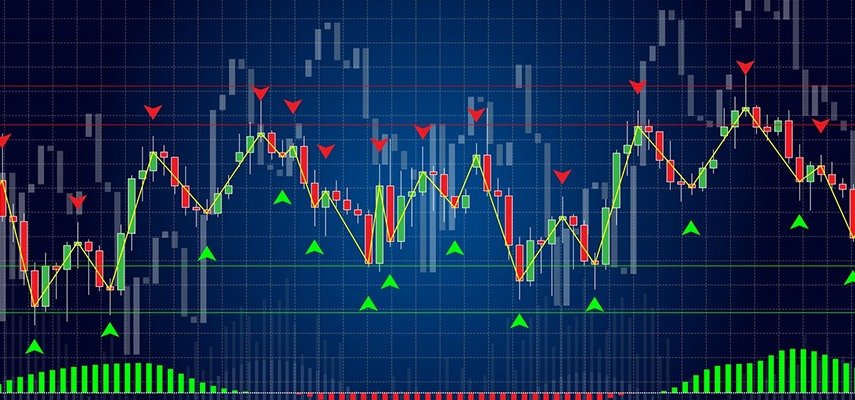
1. The Avramis Swing Indicator: Eliminating Human Bias
When it comes to traditional analysis methods, determining the actual market tops and bottoms is extremely subjective. It is possible for two analysts to look at the same chart and determine different trendlines.
The Avramis Swing Indicator makes this process automatic. Using its sophisticated algorithm, which combines candle formation patterns with the measurement of volatility, it can objectively calculate the actual cycles in a market. Since it never repaints, it provides an accurate representation of the market’s structure at any given time.
2. The Avramis Ribbon Indicator: Multi-Timeframe Trend Mastery
While trend following is straightforward in theory, in practice, a company can move up in price according to its daily chart, but fall in price according to its 15-minute chart.
The Avramis Ribbon Indicator resolves this confusion by taking into account ten separate moving averages, with each one reflecting a unique time cycle. When these moving averages fall into place in perfect order, it indicates a powerful, high probability trend. On the other hand, their compression is indicative of an imminent breakout period, which lets you predict a potential breakout long before it appears in public newsfeed systems.
3. The Avramis Block Indicator (ABI): Ridding You of the Myth of Time
The most creative instrument included in the Tradepedia arsenal is the Avramis Block Indicator. Its concept is based on point-and-figure charting, which doesn’t take time into account at all, focusing solely on prices.
Because time sometimes interferes with real market conditions, the ABI dispenses with it completely. Blocks will only appear in cases where price changes take place; this creates an extremely clear chart, revealing only absolute consolidation breakouts and continuation trends, which helps you pinpoint your entry points and place proper stops.
Changing Course from Prediction to Controlled Action
In the end, there’s no point in using these sophisticated tools to peer through the looking glass and try to predict the future. The purpose is to create a high probability action plan.
With the combination of the structure of the Avramis Swing and the momentum analysis of the Avramis Ribbon, one can create a structured approach. One doesn’t need to question whether a reversal of a market has taken place; the system tells you that, saves your money from impulsive trades, and allows you to act with the experience of a pro.
Conclusion: Improving Your Game with Tradepedia UAE
To excel in technical analysis, one must move away from backward-looking, retail-oriented measures and embrace objectivity through systematic algorithms. In replacing conventional chart-based approaches with institutional-quality software, such as the Avramis Indicators, one is taking the emotions and time lags involved in traditional methods out of the equation entirely.
Traders in the Middle Eastern region interested in adopting these sophisticated systems can do so by leveraging Tradepedia UAE, which stands as the authorized gateway for this purpose within the area. Located in the Dubai International Financial Centre (DIFC), Tradepedia UAE offers the necessary licensing, indicators, and professional guidance for applying these sophisticated algorithms to any market around the world.
Stop allowing the noise of the market to govern your portfolio’s success. Check out the educational offerings and unique indicators at Tradepedia UAE.
Frequently Asked Questions (FAQs)
What is special about Avramis Indicators as opposed to regular trading indicators?
Regular indicators (such as basic MACD and RSI) are lagging algorithms that are calculated according to historical time frames, thus causing late signals or even erroneous signals altogether. Avramis Indicators are sophisticated algorithmic programs that include price action structure patterns and volatility metrics in their equations. They eliminate bias and any form of delay, and they will never repaint past data on the chart.
How does Avramis Block Indicator function independent from time?
Avramis Block Indicator works independently of any time element because it was designed to track price action without any consideration of time at all. Thus, the indicator does not take into account regular time increments such as 5 minutes, 1 hour, etc., and displays a block formation only once price reaches a quantifiable level.
Are beginner traders able to make effective use of Tradepedia Indicators?
Yes. Although the technologies behind these instruments are extremely complicated, the results are made with ease of interpretation in mind. They enable novice traders to rely on objective market top detection, bottom detection, and direction, thus helping avoid the emotional guesswork typical for subjective analysis leading to account loss from the get-go.
What classes of financial assets are tradable with these indicators?
As the algorithmic models used are based on general principles of supply, demand, and volatility, they work seamlessly in all available liquid financial markets around the world. These indicators are employed by traders around the globe to identify structures within prices in Forex markets, major world equities and stock indices, gold, oil, and cryptocurrencies.